Have you ever wondered what makes some crypto traders more successful than others? The secret often lies in their ability to read chart patterns. These patterns are not just random shapes on a graph; they’re crucial indicators of market trends.
In this article, we’ll discover the most common chart patterns, from simple to more complex ones. We’ll explore how we can interpret them and make them part of our trading strategy.
We’ll also see how you can use Kriptomat’s vast variety of tools, including advanced charting, to enhance your crypto trading strategies. Whether you’re a newbie or a seasoned trader, mastering chart patterns can sharpen your trading decisions.
Chart analysis in a nutshell
Technical analysis is a crucial part of crypto trading. It uses historical price and volume data to forecast market behaviour, unlike fundamental analysis which focuses on intrinsic value.
Traders employ methods like chart patterns to spot trends and turning points, based on the principle that price movements follow past trends and patterns. Chart patterns, either signalling a trend reversal or continuation, offer insights into market direction.
Understanding these patterns involves grasping market psychology and the collective emotions of traders. This comprehension allows traders to align their strategies with market sentiment, enhancing their decision-making.
Single-candle chart patterns
Single-candle chart patterns provide rapid insights into crypto market sentiment, each revealing potential shifts with just one candlestick. This section will explore these critical patterns, emphasising their importance in swift trading scenarios.
Doji
The Doji is a unique single-candle pattern characterised by its small body, with opening and closing prices nearly the same. Visually, it appears as a thin line with wicks on one or both ends.
A Doji represents market indecision, where neither buyers nor sellers gain ground. It often signals a potential reversal in the current trend, especially when found after a prolonged up or down movement.

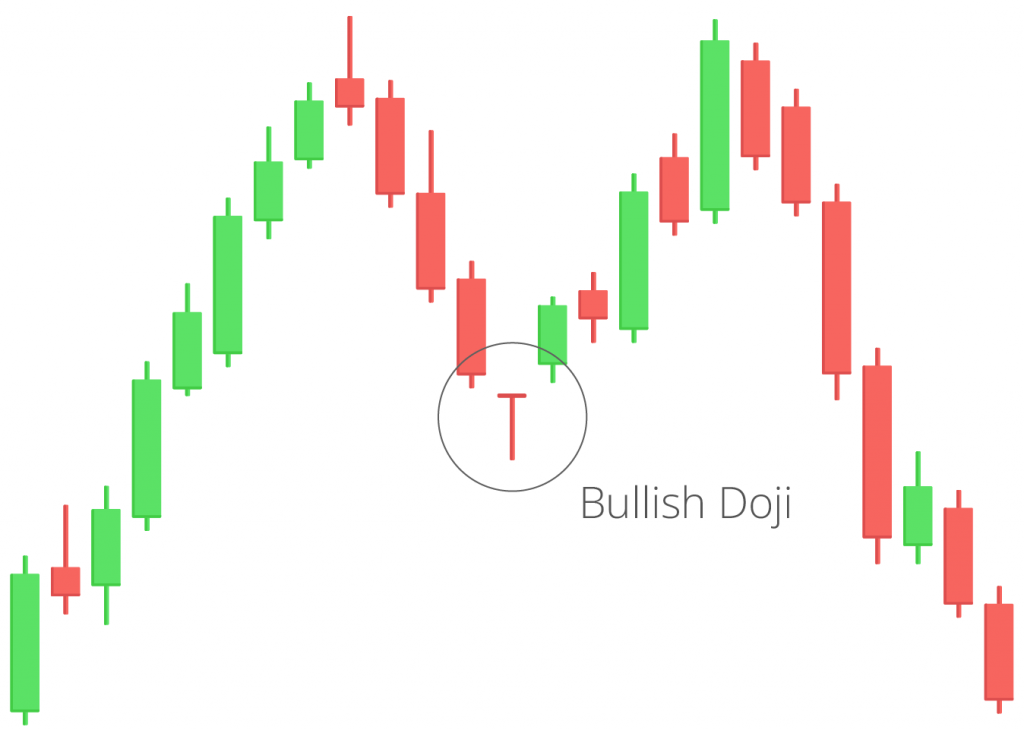
Bearish and Bullish Doji
Hammer and Hanging Man
Both the Hammer and Hanging Man are single-candle patterns with small upper bodies and long lower wicks. The Hammer appears in a downtrend and suggests a potential upside reversal. Conversely, the Hanging Man forms in an uptrend, indicating a possible downside reversal.
Traders often view the Hammer as a buying opportunity, expecting upward momentum. The Hanging Man, however, warns of selling pressure, suggesting caution or potential short positions.


Hammer and Hanger Man
Shooting Star and Inverted Hammer
The Shooting Star and Inverted Hammer are mirror images. The Shooting Star, occurring in an uptrend, has a small lower body and a long upper wick, signalling bearish reversal. The Inverted Hammer, found in downtrends, also has a long upper wick but forecasts bullish reversal.
The Shooting Star warns traders of potential downward movement, suggesting a sell or short position. The Inverted Hammer, on the other hand, indicates a potential upward swing, presenting a buying opportunity.
Mastering single-candle chart patterns offers traders a significant advantage in the volatile crypto market. These succinct yet powerful patterns offer quick insights into market dynamics, enhancing timely decision-making when combined with broader analysis.


Shooting Star and Inverted Hammer
Multi-candle chart patterns
Multi-candle chart patterns are essential in crypto trading, offering a comprehensive view of market trends and sentiment. These patterns, formed over several price candles, provide key insights into the market’s future direction:
Head and Shoulders Pattern and Inverted Head and Shoulders
This pattern is characterised by three peaks, with the middle one (the head) being the highest and the two others (shoulders) being lower and roughly equal in height. It signals a reversal from a bullish to a bearish trend.
When this pattern completes, traders often consider it a strong signal to sell or short, especially if the price breaks below the ‘neckline’ – the support level connecting the lows of the two troughs.
Conversely, the Inverted Head and Shoulders pattern is a bullish chart formation often signalling a potential reversal of a downtrend. It consists of three troughs, with the middle trough (head) being the deepest and the two side troughs (shoulders) being shallower.
When this pattern is completed, typically by a breakout above the neckline (the resistance line connecting the peaks of the two shoulders), it suggests a strong likelihood of an upward price movement.
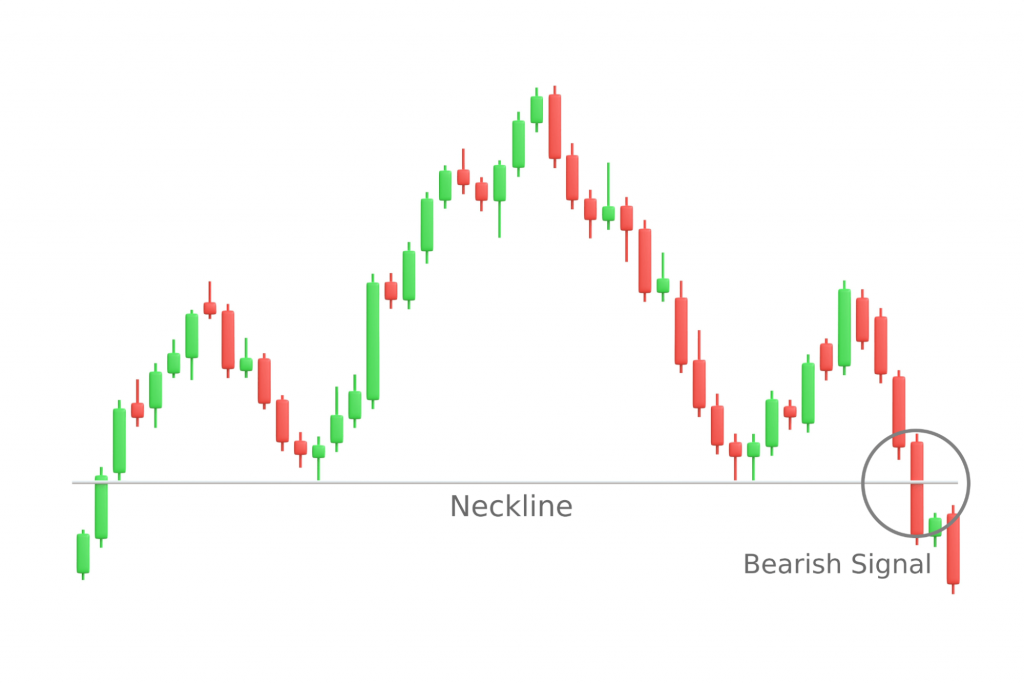
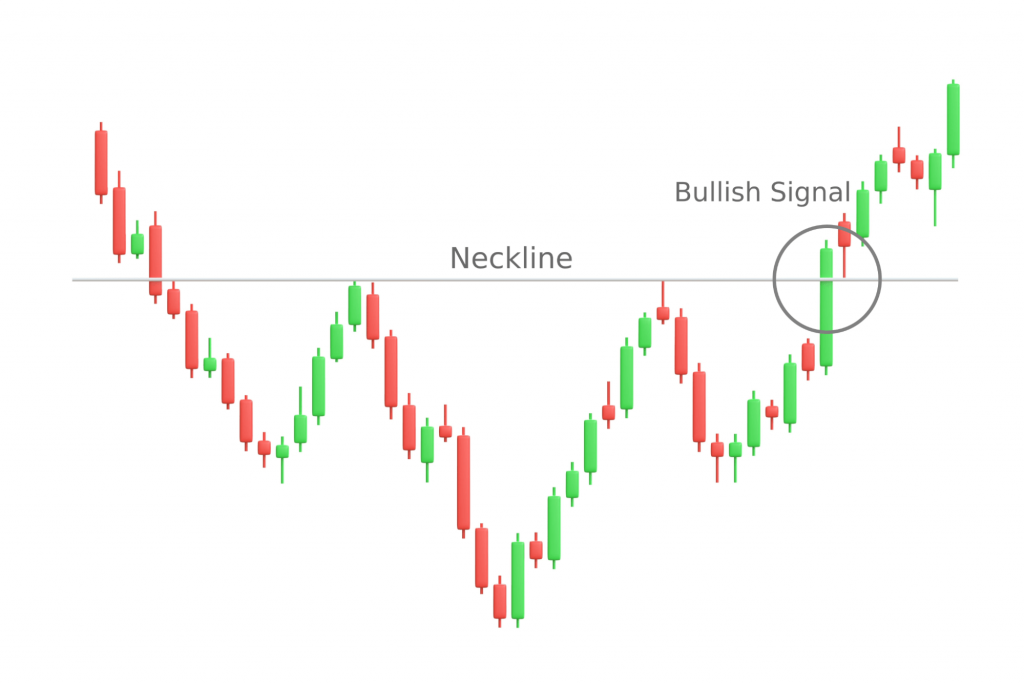
Head and Shoulders, and Inverted Head and Shoulders
Double Top and Double Bottom
The Double Top appears as two consecutive peaks at approximately the same level, indicating a potential bearish reversal. Conversely, the Double Bottom, with two consecutive troughs, suggests a bullish reversal.
Traders might consider selling after a Double Top confirmation when prices fall below the support level between the peaks. For Double Bottoms, buying when the price exceeds the resistance level between the troughs can be favorable.
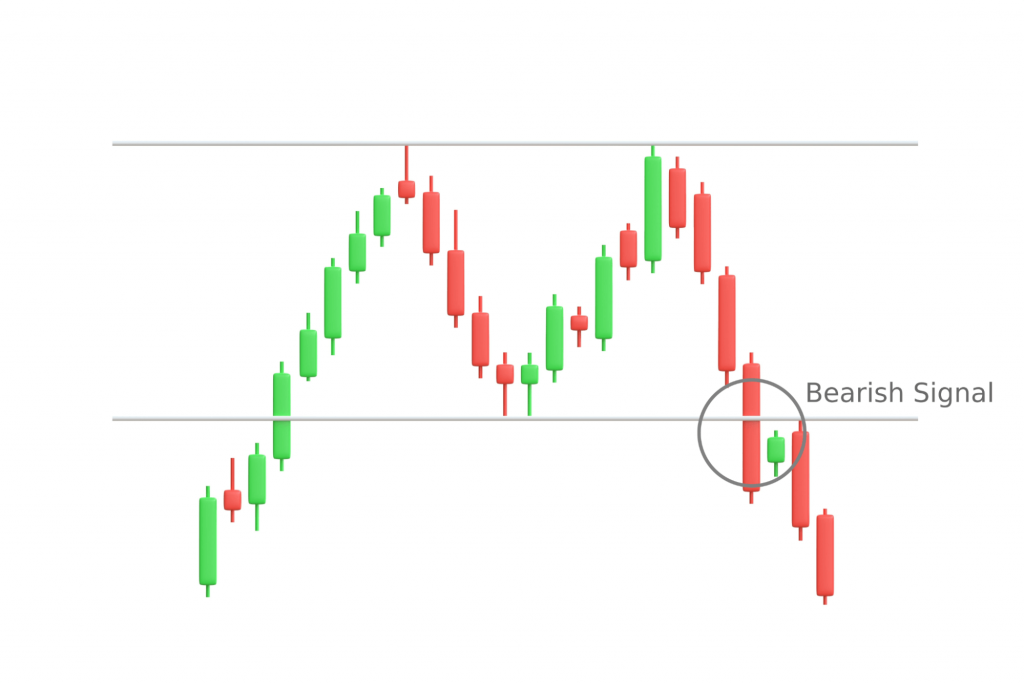
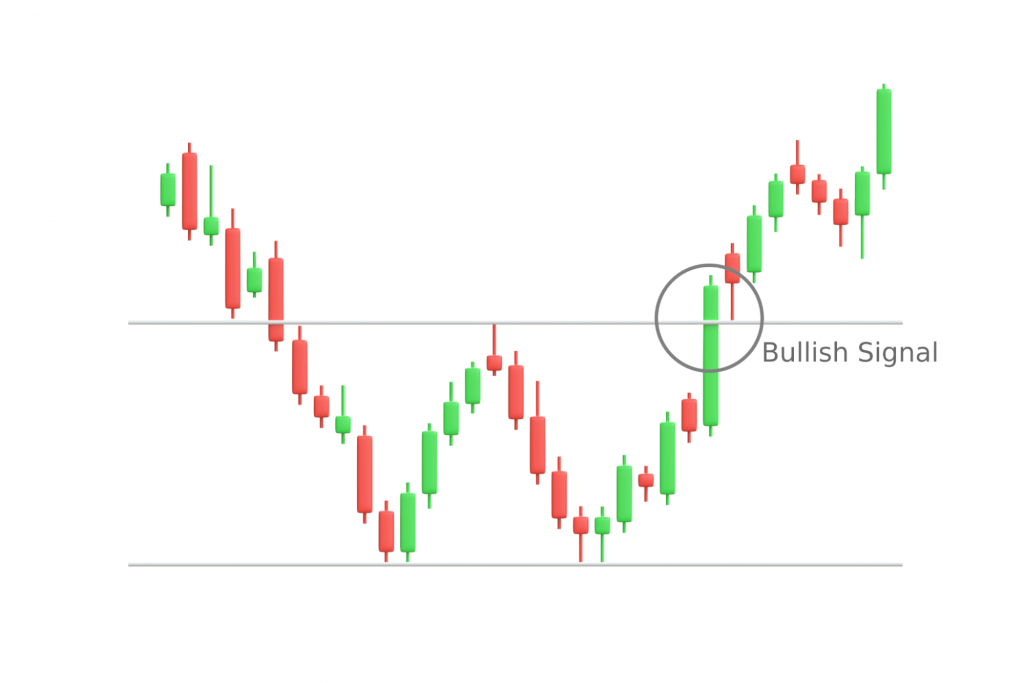
Double Top and Double Bottom
Triangle (ascending, descending, and symmetrical)
Triangle patterns are formed by converging trend lines. The Ascending Triangle has a flat top and rising bottom, indicating bullish sentiment. The Descending Triangle has a flat bottom and a declining top, signalling bearishness. The Symmetrical Triangle, with both sides converging, indicates uncertainty.
Ascending Triangles are typically followed by an upward price breakout, while Descending Triangles often lead to a downward breakout. Symmetrical Triangles can break out in either direction, so traders should watch for a clear price move beyond the triangle.
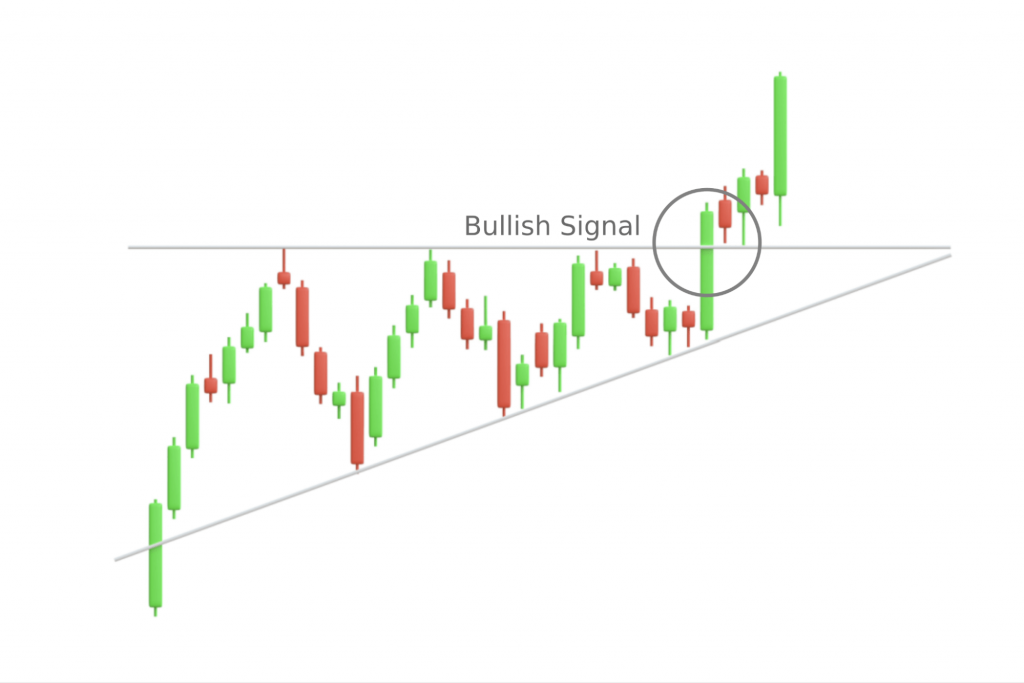
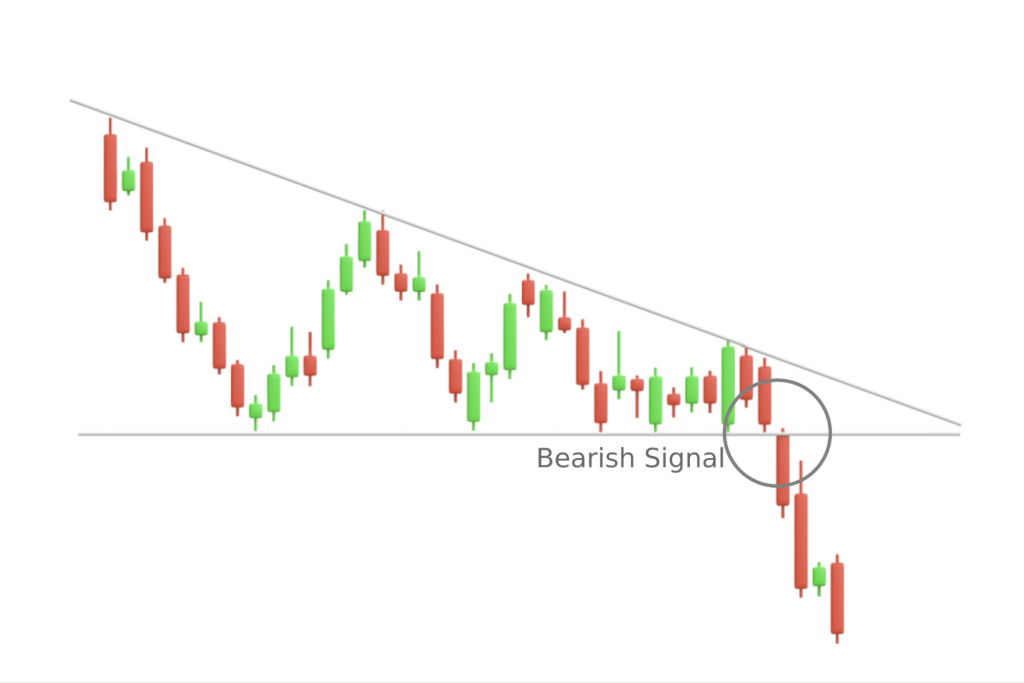
Ascending Triangle and Descending Triangle
Flags
Flags are short-term continuation patterns that resemble a small rectangle sloping against the prevailing trend. They indicate a consolidation period followed by a continuation of the trend. Traders often wait for the price to break out of the pattern in the direction of the prevailing trend before making a move.
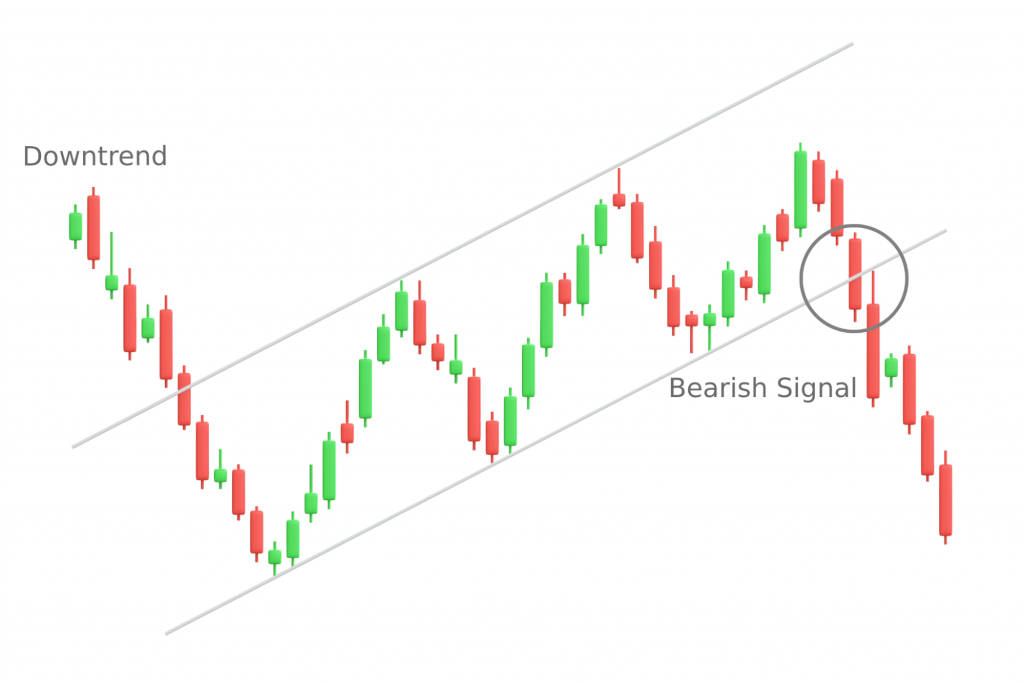
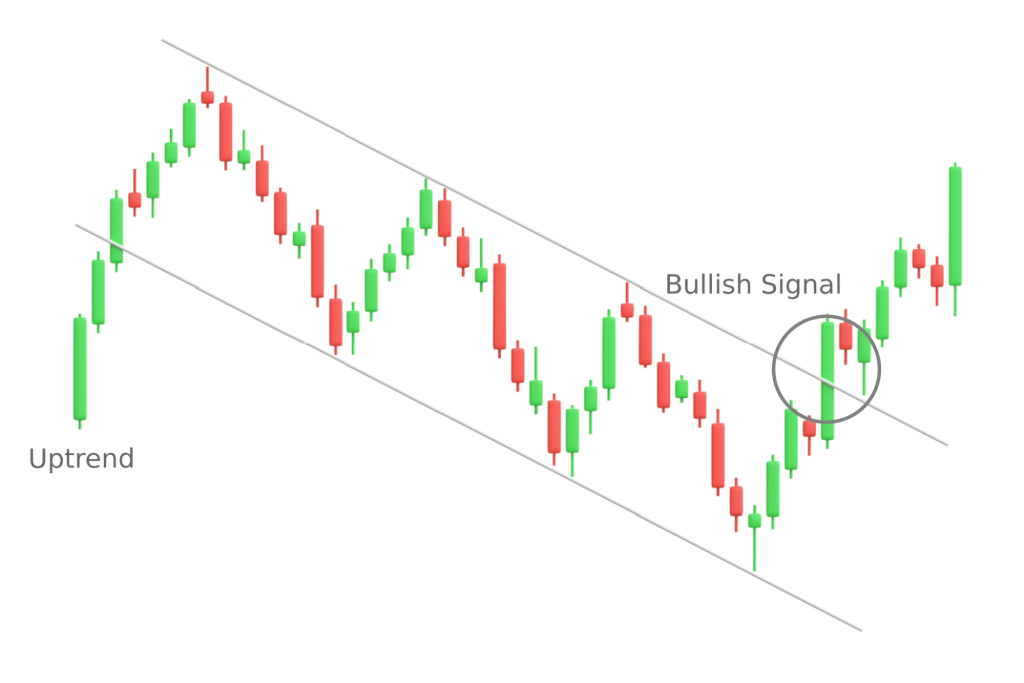
Bearish Flag and Bullish Flag
Grasping multi-candle chart patterns is a game-changer in cryptocurrency trading as they offer crucial hints about where the market might head next. While they’re not foolproof, combining these patterns with other analysis techniques can significantly enhance your trading acumen.
Combine chart patterns with other indicators
While chart patterns provide valuable insights into market trends, their effectiveness increases when combined with other technical indicators, such as:
- Moving Averages: These indicators help smooth out price data to create a single flowing line, making it easier to identify the direction of the trend. For instance, a bullish chart pattern aligned with a price moving above a significant moving average (like the 50-day or 200-day) can reinforce a buy signal. Dive deep into moving averages with our guide: “How to Use Moving Averages for Crypto Trading”.
- Relative Strength Index (RSI): RSI measures the speed and change of price movements. A chart pattern signalling a trend reversal, when coupled with an RSI moving out of an overbought or oversold condition, can confirm the strength of the reversal.
- Bollinger Bands: These are used to measure market volatility. A chart pattern forming near the upper or lower band can signal a potential reversal, especially if the bands are beginning to narrow, indicating reduced market volatility.
Combining chart patterns with technical indicators not only validates the signals provided by each but also helps in reducing false positives, leading to more confident trading decisions in the crypto market.
Practical tips for traders
Let’s cover how you can avoid common mistakes in interpreting chart patterns.
- Wait for confirmation: One of the most common mistakes is acting on a pattern too early. It’s crucial to wait for the pattern to fully form and confirm. For example, a perceived ‘Head and Shoulders’ pattern might not complete, leading to incorrect predictions if acted upon prematurely.
- Context matters: Always consider the bigger market picture. A chart pattern should not be read in isolation. Market conditions, news, and other technical indicators should align with what the pattern suggests.
- Avoid over-reliance: Relying solely on chart patterns can be risky. They are tools, not crystal balls. Use them as part of a broader analysis strategy.
Understanding and interpreting chart patterns is an art that requires patience and practice. By avoiding common pitfalls, emphasising risk management, and adopting a diversified approach, traders can enhance their ability to make informed trading decisions.
How to maximise your trading strategy with Kriptomat
In crypto trading, the right tools are essential for enhanced analysis and strategy. Kriptomat provides a suite of features that perfectly complement moving averages and other analytical methods:
- Diverse crypto assets: Access a broad range of cryptocurrencies with Kriptomat, ideal for analysing different chart patterns and diversifying your investment portfolio.
- Advanced price charts: Use Kriptomat’s sophisticated price charts to apply moving averages on price charts, aiding in the identification of trends and potential trading points.
- Automated trading solutions: Leverage Kriptomat’s Recurring Buy for consistent, automated investing, and implement Automatic Buy/Sell orders at predetermined prices for strategic trading. Additionally, delve into Intelligent Portfolios for optimised cryptocurrency investments, crafted using advanced algorithms.
- Advanced tracking tools: Kriptomat’s Watchlist feature streamlines the tracking of chosen cryptocurrencies, while the Price Alerts system provides notifications on desired price shifts.
- Portfolio Analytics: Track and assess your investment performance with Kriptomat’s advanced analytics. These insights can fine-tune your trading strategies. Check out our tutorial “What is Portfolio Analytics and how to use it?” for a deeper dive into managing your portfolio effectively.
- Responsive customer support: For any queries or assistance, Kriptomat’s customer support team is readily available to help.
Integrating Kriptomat’s tools into your trading regimen can empower you to make well-informed decisions, keeping you a step ahead in the fast-paced world of cryptocurrency.
Zooming out
Mastering both single-candle and multi-candle chart patterns is vital for successful cryptocurrency trading. These patterns, along with additional technical indicators, offer valuable insights into market trends. However, traders should approach chart analysis with caution, incorporating risk management and diversified strategies to navigate the market effectively.
We invite you to explore more on this topic and enhance your trading skills with Kriptomat. Our platform not only offers essential trading tools but also a rich array of educational content. Sign up with Kriptomat to stay informed and equipped in the ever-evolving world of crypto trading.
NOTE
This text is informative in nature and should not be considered an investment recommendation. It does not express the personal opinion of the author or service. Any investment or trading is risky, and past returns are not a guarantee of future returns. Risk only assets that you are willing to lose.



 IOS
IOS Android